Every View You Need
From big-picture class trends to individual student deep-dives.
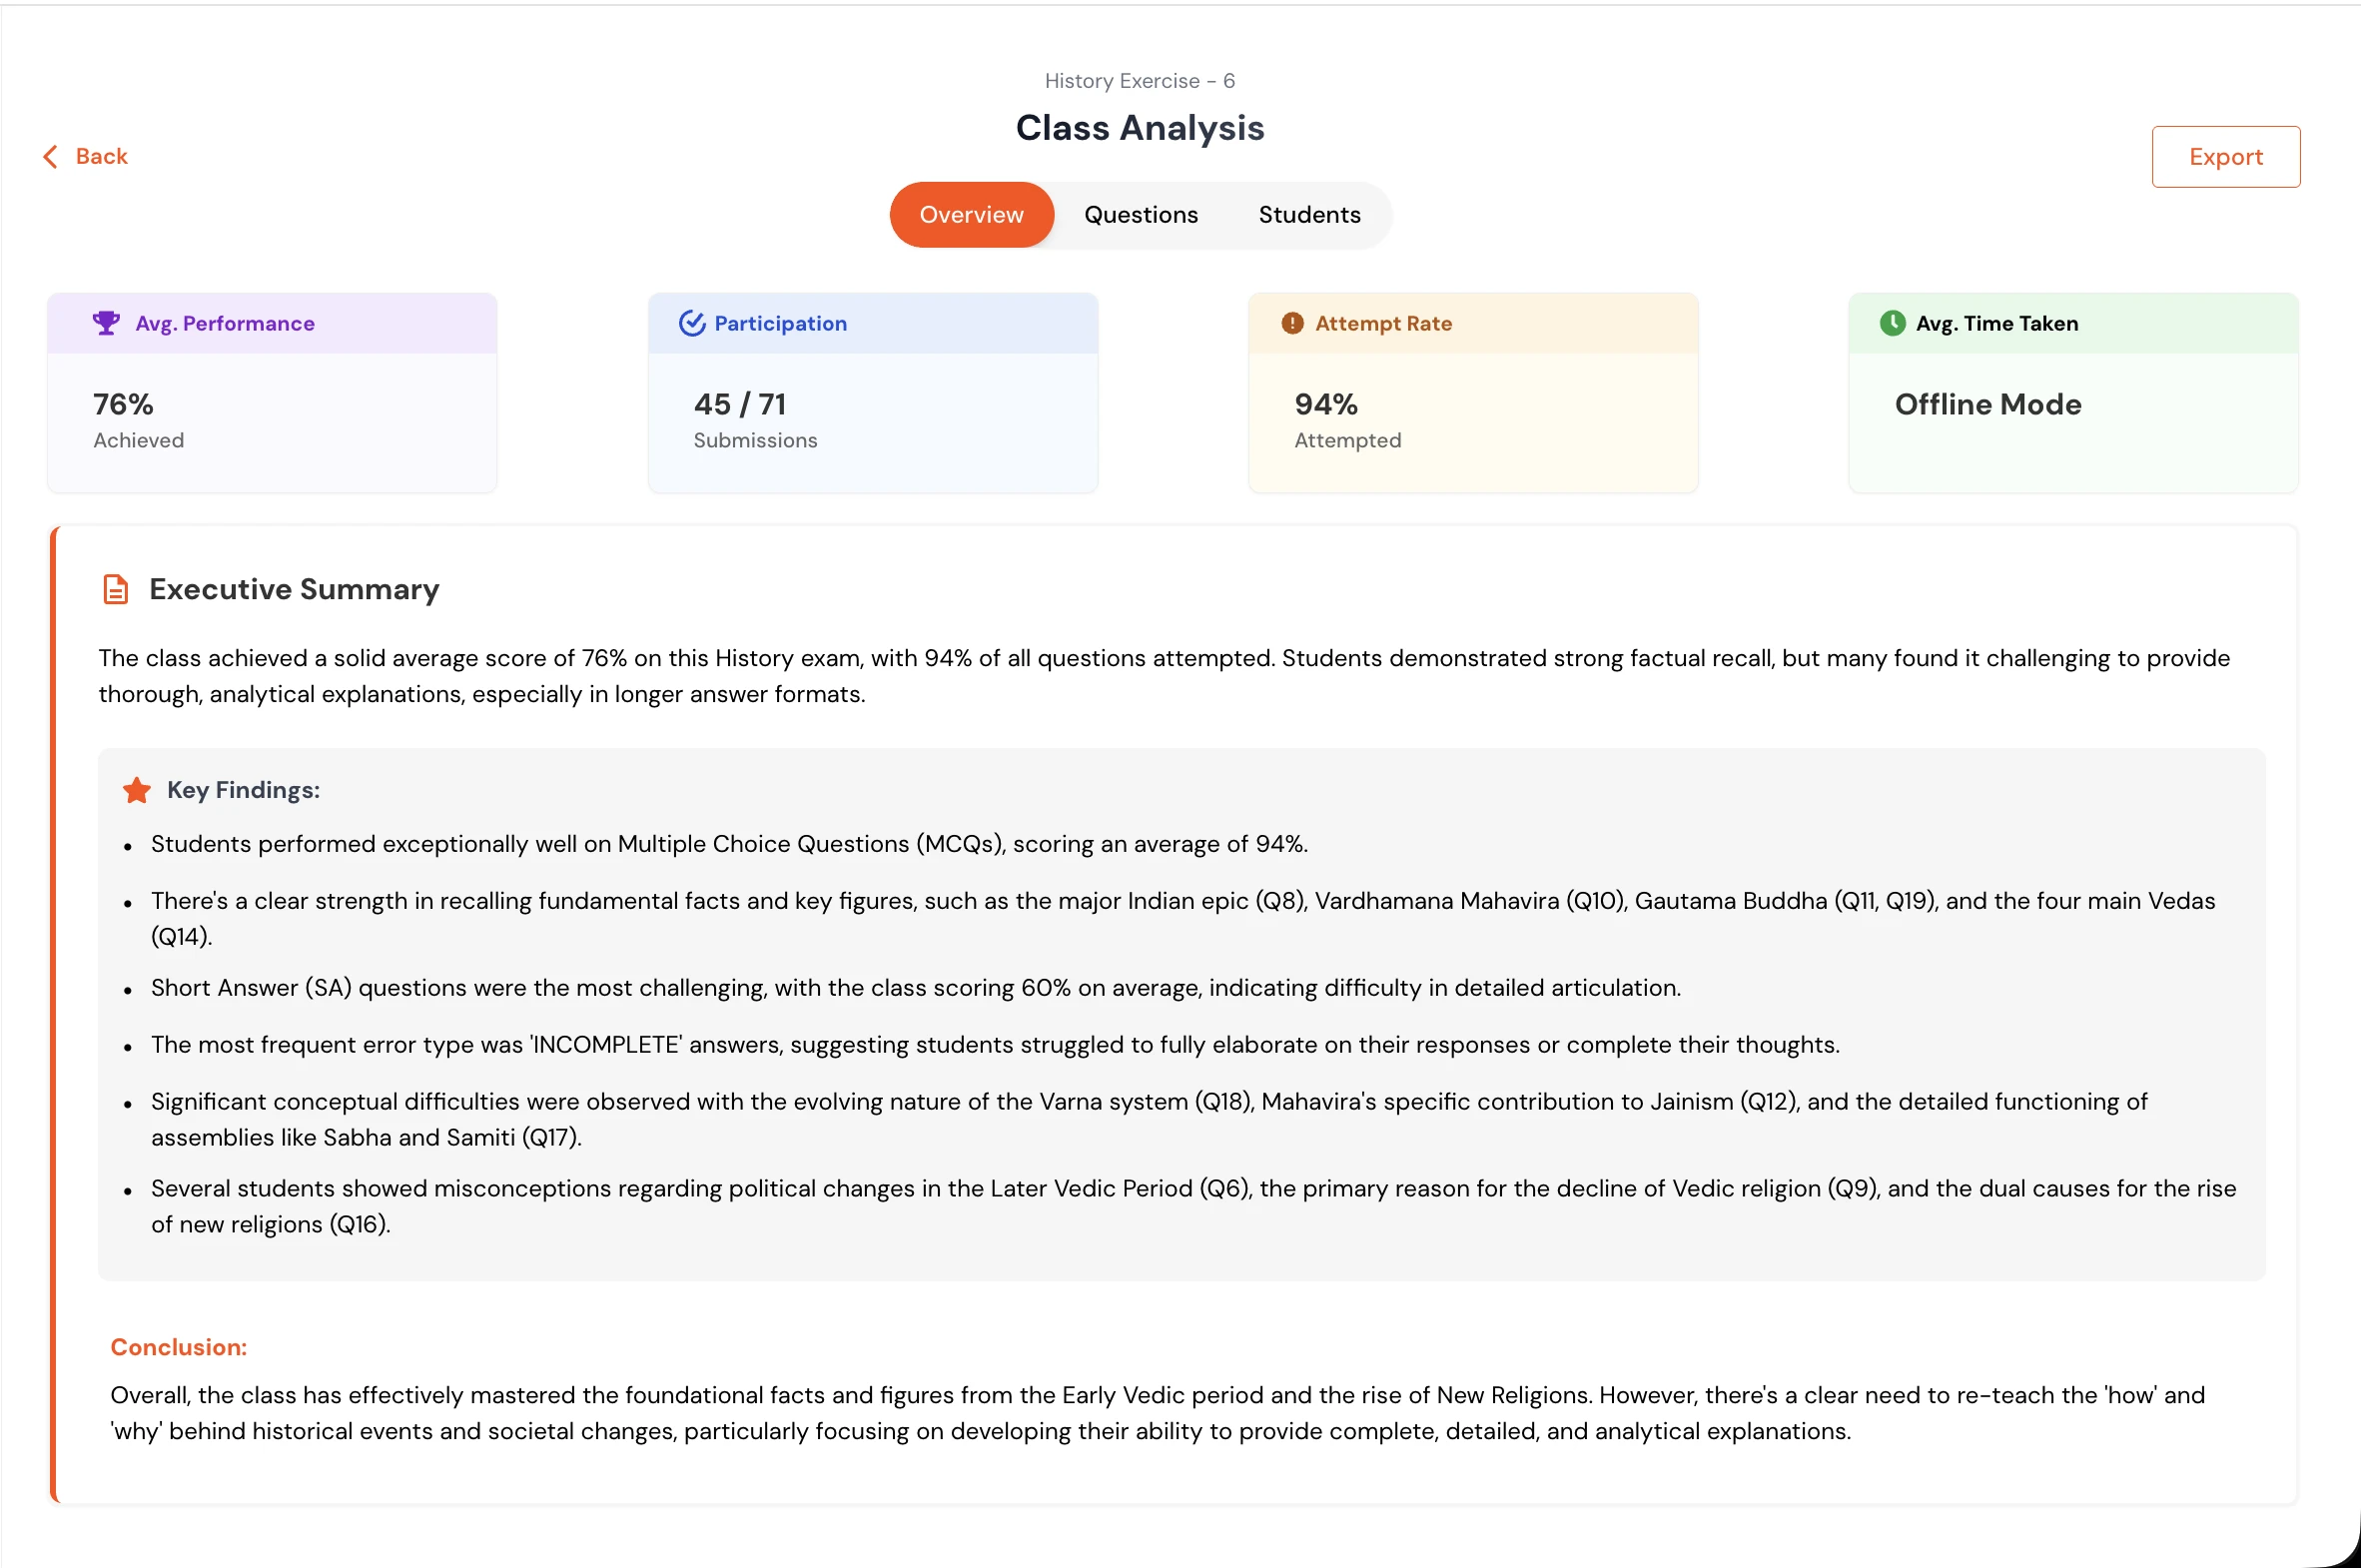
Class Overview
See your entire class at a glance—completion rates, average scores, topic-wise performance distribution.
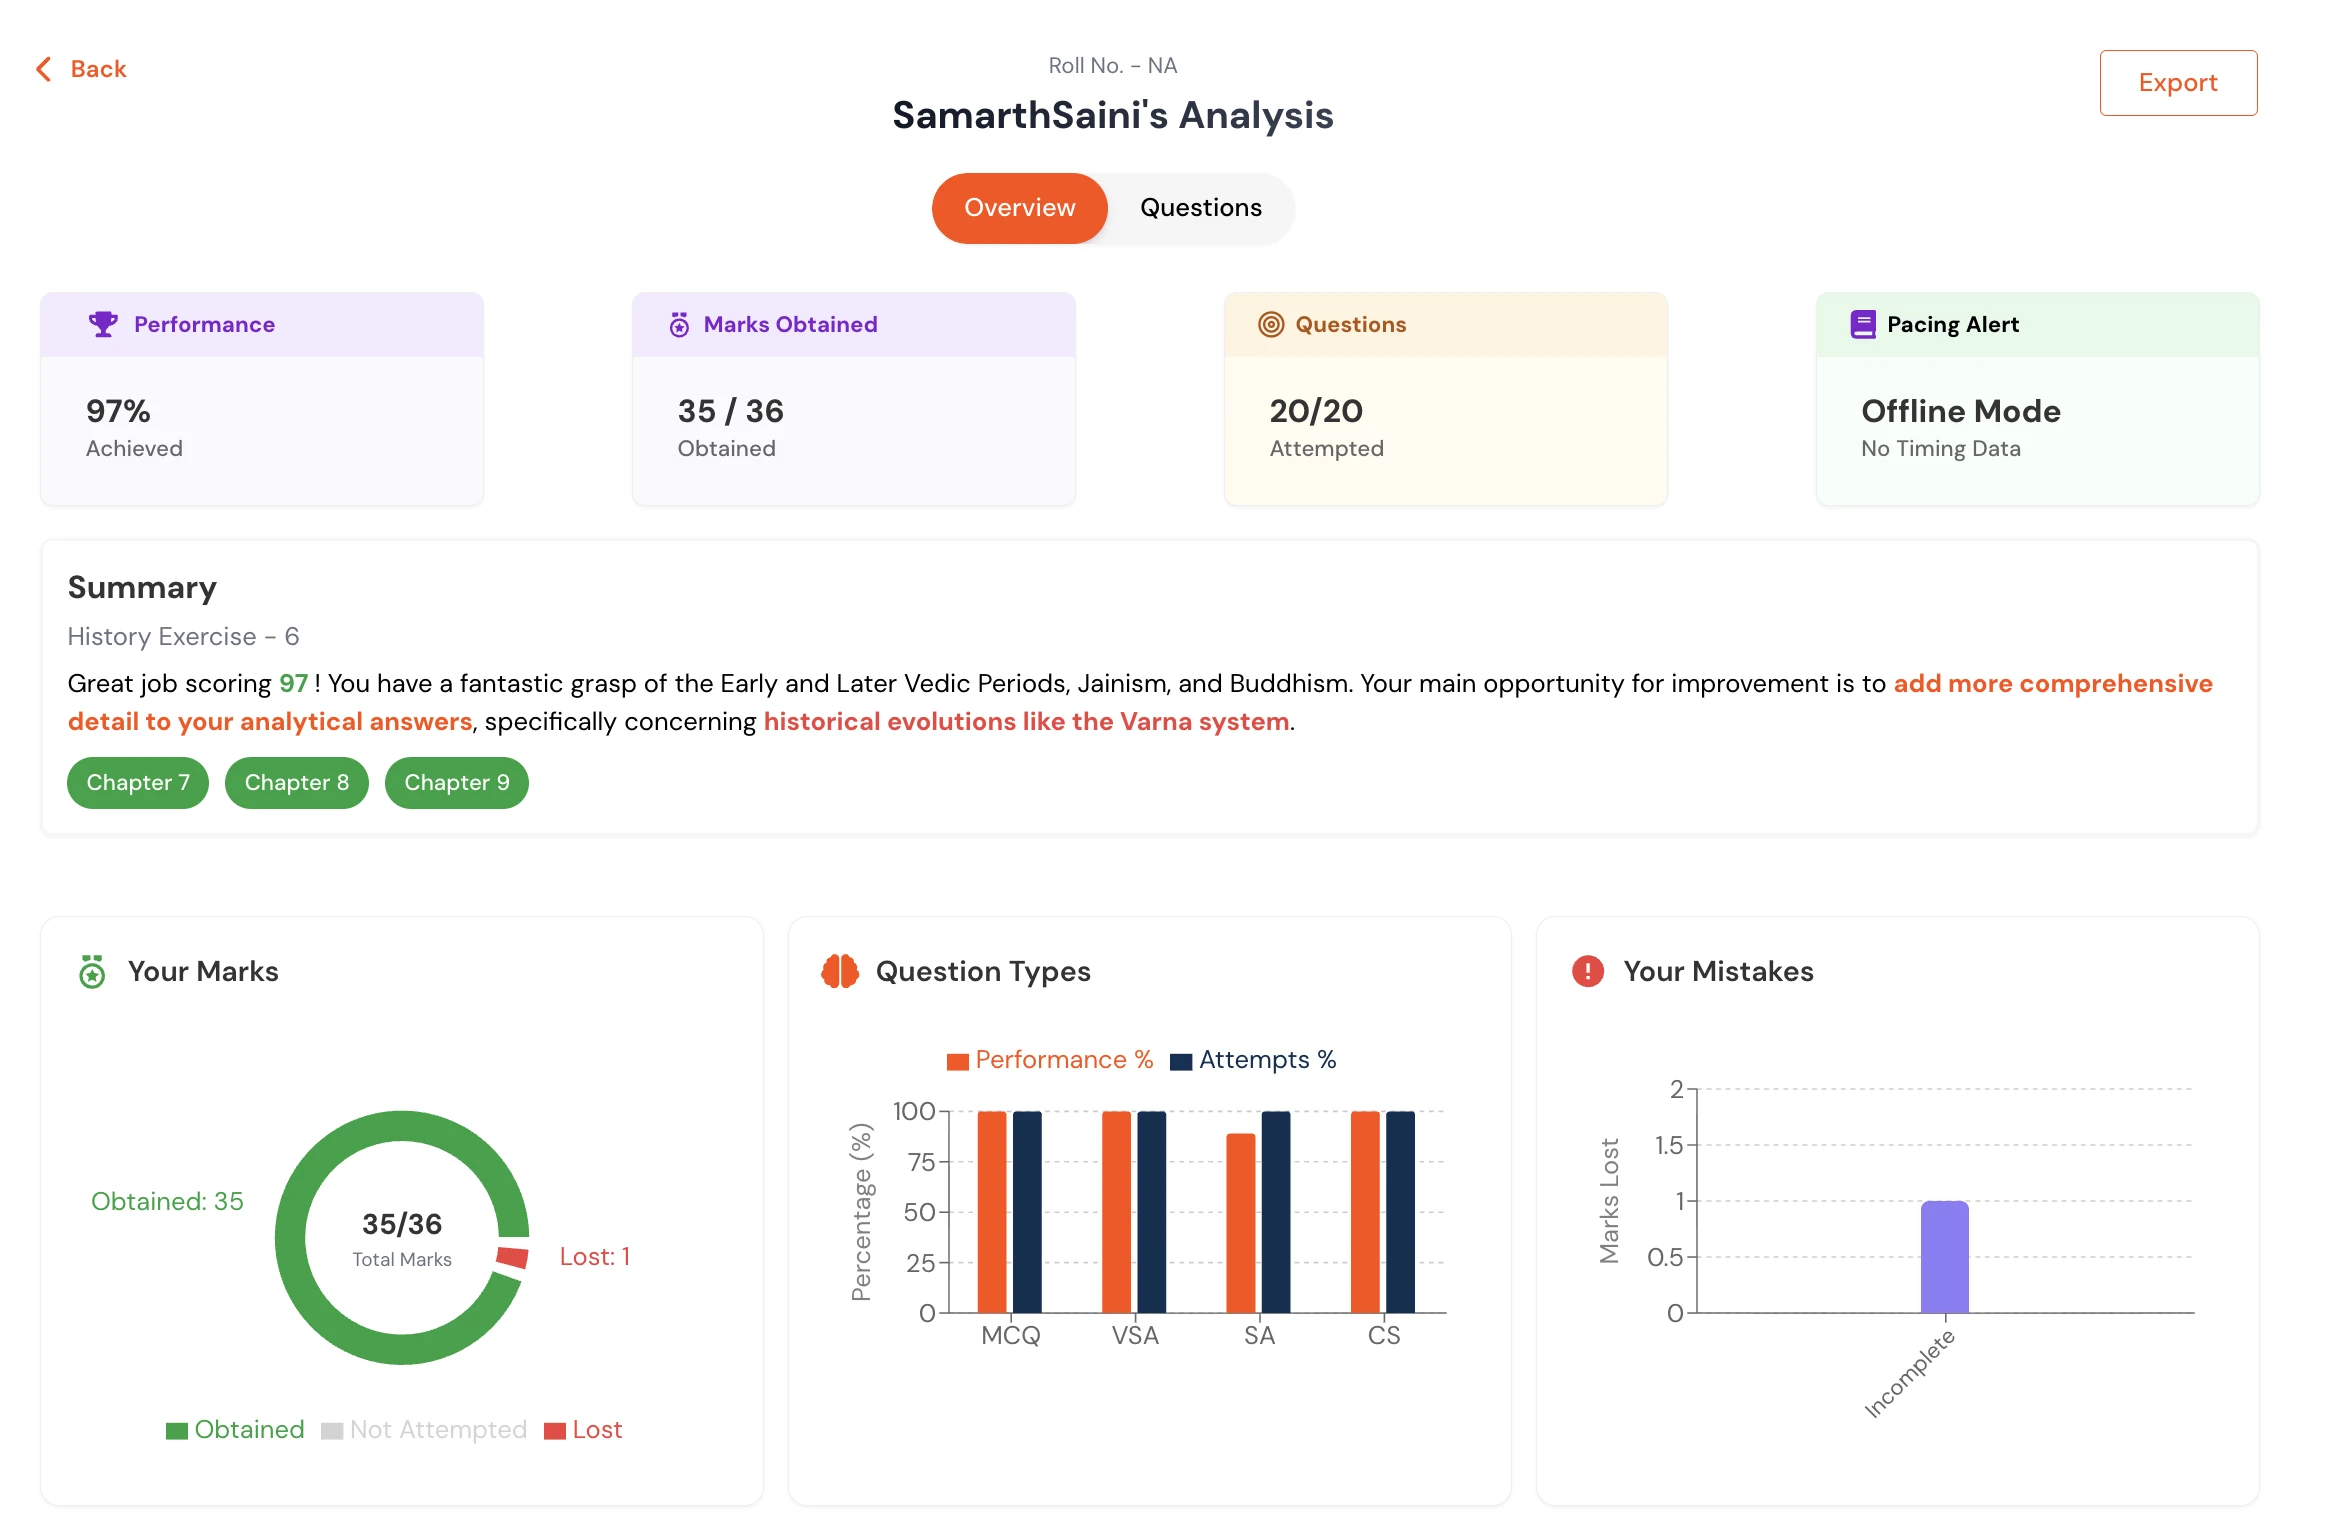
Individual Student Reports
Deep dive into each student's learning journey—strengths, weaknesses, progress over time.
Insights for Every Stakeholder
Different roles need different views. Our dashboard adapts to show what matters most.
For Teachers
- Which topics need re-teaching
- Students requiring extra attention
- Class performance trends
- Question-wise difficulty analysis
For Principals
- School-wide learning health
- Cross-class comparisons
- Teacher effectiveness metrics
- Curriculum gap identification
For Parents
- Child's progress report
- Strengths and growth areas
- Home practice recommendations
- Comparison with class average
Powerful Analytics, Simple Interface
No data science degree required. Get actionable insights with a few clicks.
Progress Tracking
Watch learning happen in real-time. See who's improving, who's stuck, and who needs intervention.
Early Warning System
Get alerts when a student starts falling behind—before it becomes a crisis at exam time.
Topic-Wise Analysis
Identify exactly which concepts are causing trouble. Plan remedial sessions with precision.
Comparative Insights
Compare classes, sections, or time periods. Understand what's working and what isn't.
Ready-Made Reports
Generate PTM reports, term-end summaries, and intervention lists with a single click.
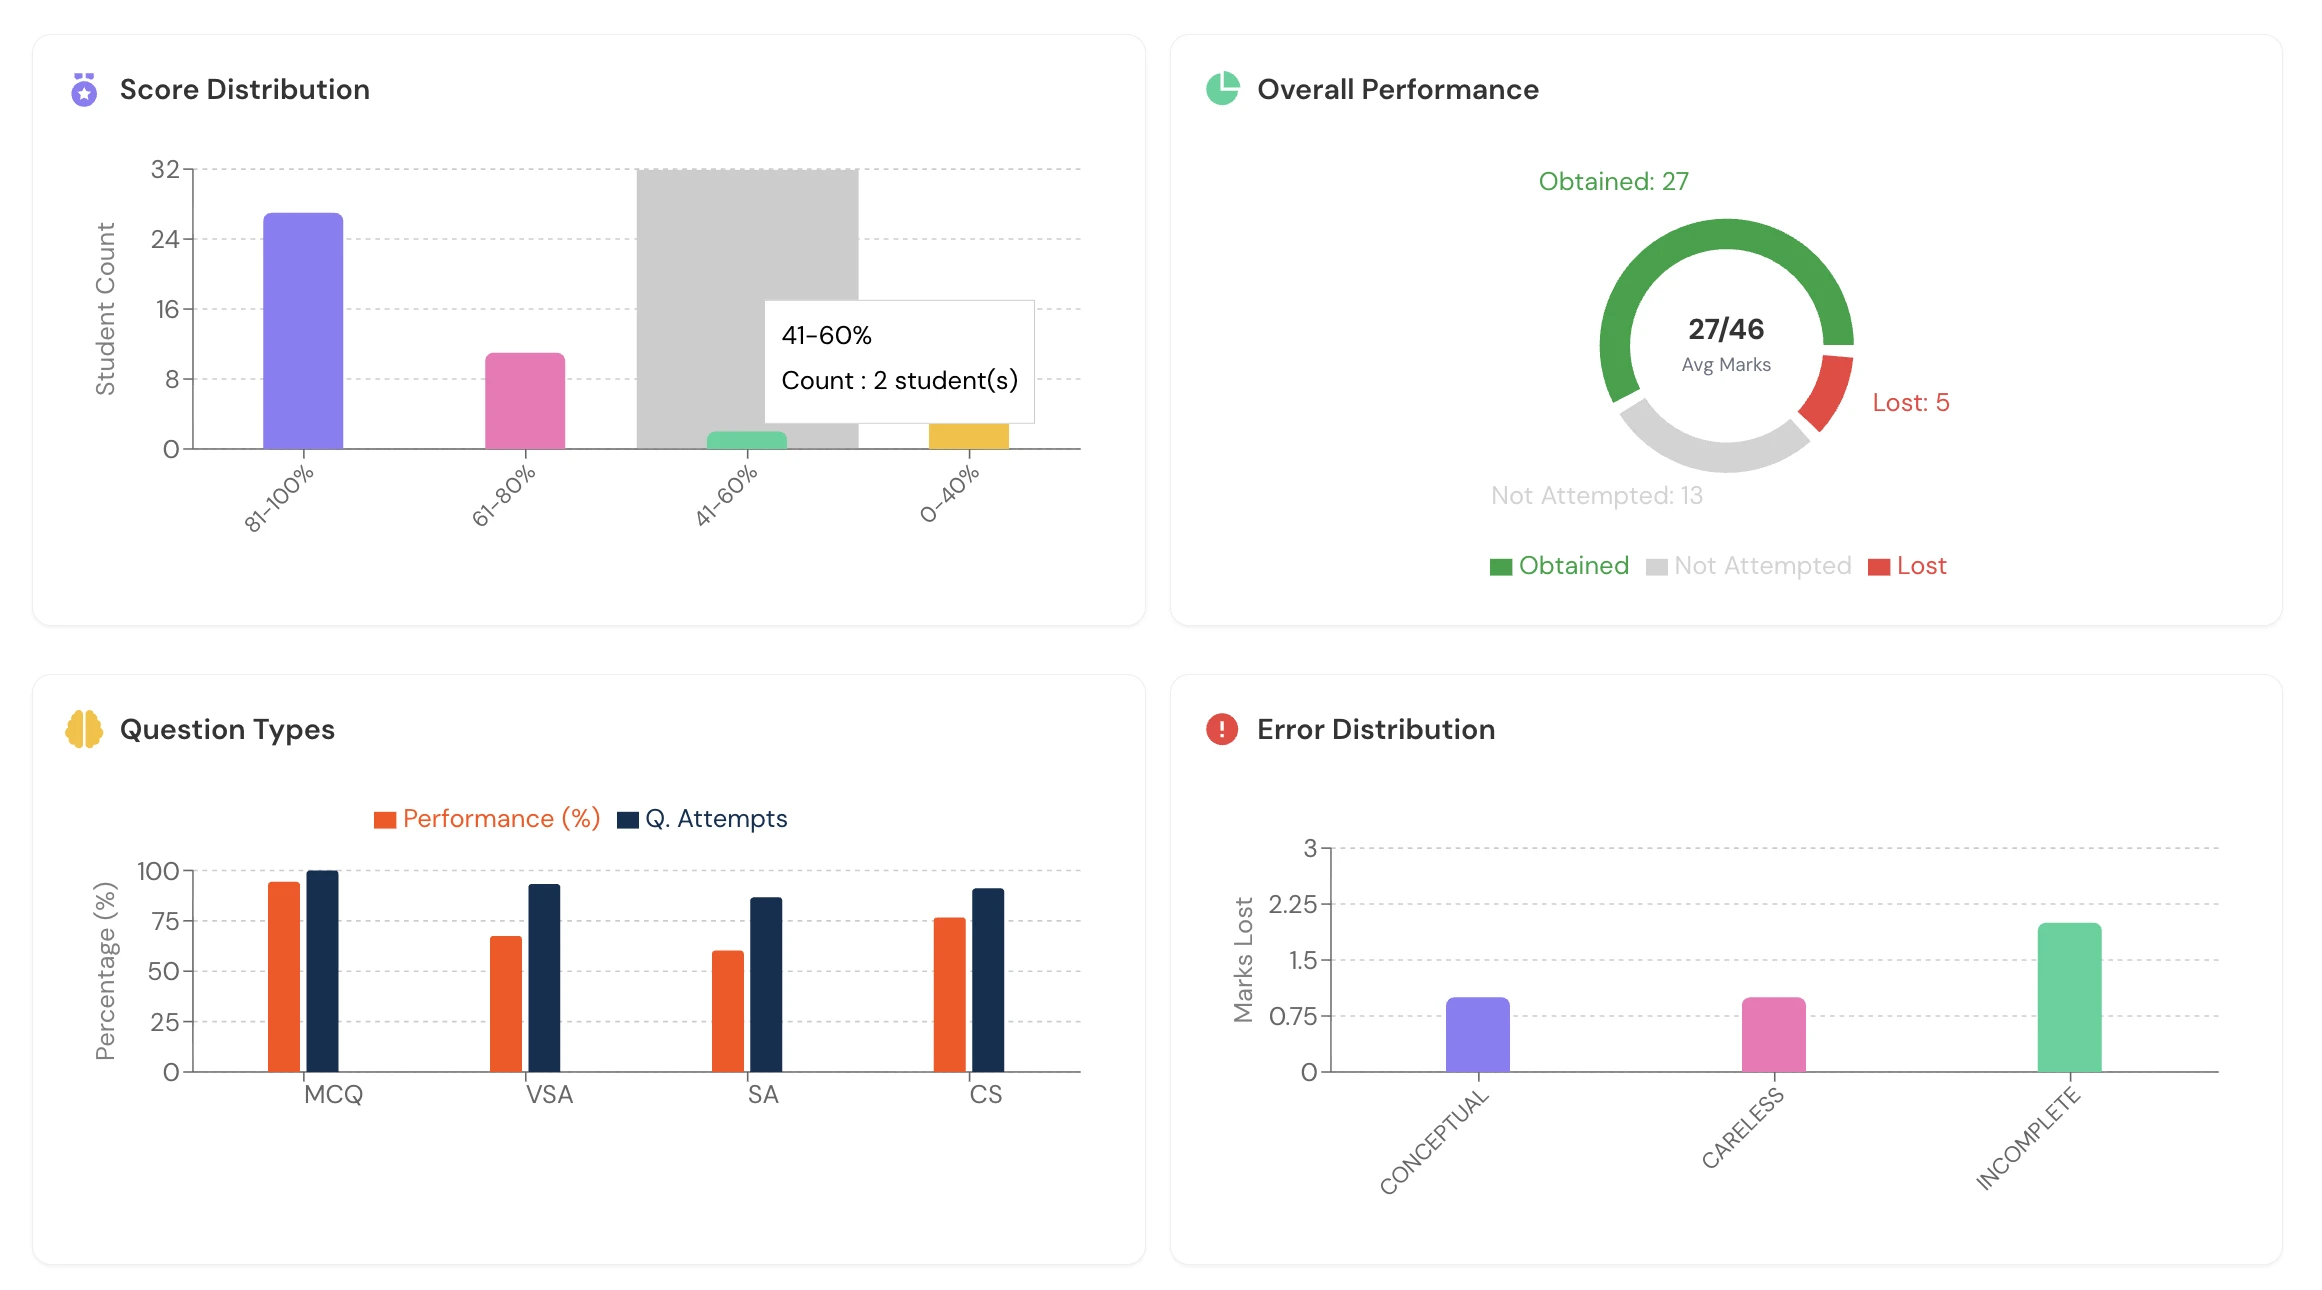
Visual Analytics
Charts, graphs, and heatmaps that make complex data instantly understandable.